Usage
-
Home
-
Flow diagram of available spatial and scRNA-seq datasets.
-
Bar graph of datasets available from each brain region.
-
Pie cart of available study types and conditions.
-
Interactive plot for visualizing cell types and spatial layers.
-
-
Browse
-
scRNA-seq datasets: 172 datasets, 34 studies, 18 brain regions, and 2,194,144 cells.
-
Spatial Transcriptomics datasets: 300 spatial datasets, 10 studies, and 17 brain regions.
-
Sort by species, brain region, and experimental factors.
-
-
Query
-
Search differentially expressed genes.
-
Find overlapping differentially expressed genes from multiple comparisons from a cell type of interest in a specific brain region and set your own parameters.
-
-
Help
-
Usage
-
Frequently asked questions
-
Contact
-
News: updates on ssREAD
-
-
Download
-
Download raw and processed datasets.
-
Steps to run ssREAD backend workflow locally.
-
-
Version 1 (Archived)
- Explore ssREAD version 1.
scRNA-seq Result Illustration
We used AD00103 this dataset to showcase, it consists of 6,629 cells comes from the human AD female prefrontal cortex region in Mathys, et al. research.
This tutorial will guide you through the analysis result page of ssREAD in detail.
General information
The general information of this dataset is shown in the first section of the analysis result page. This section includes four parts: Overview, Dataset information, Dataset source, and related datasets from the similar experiment.
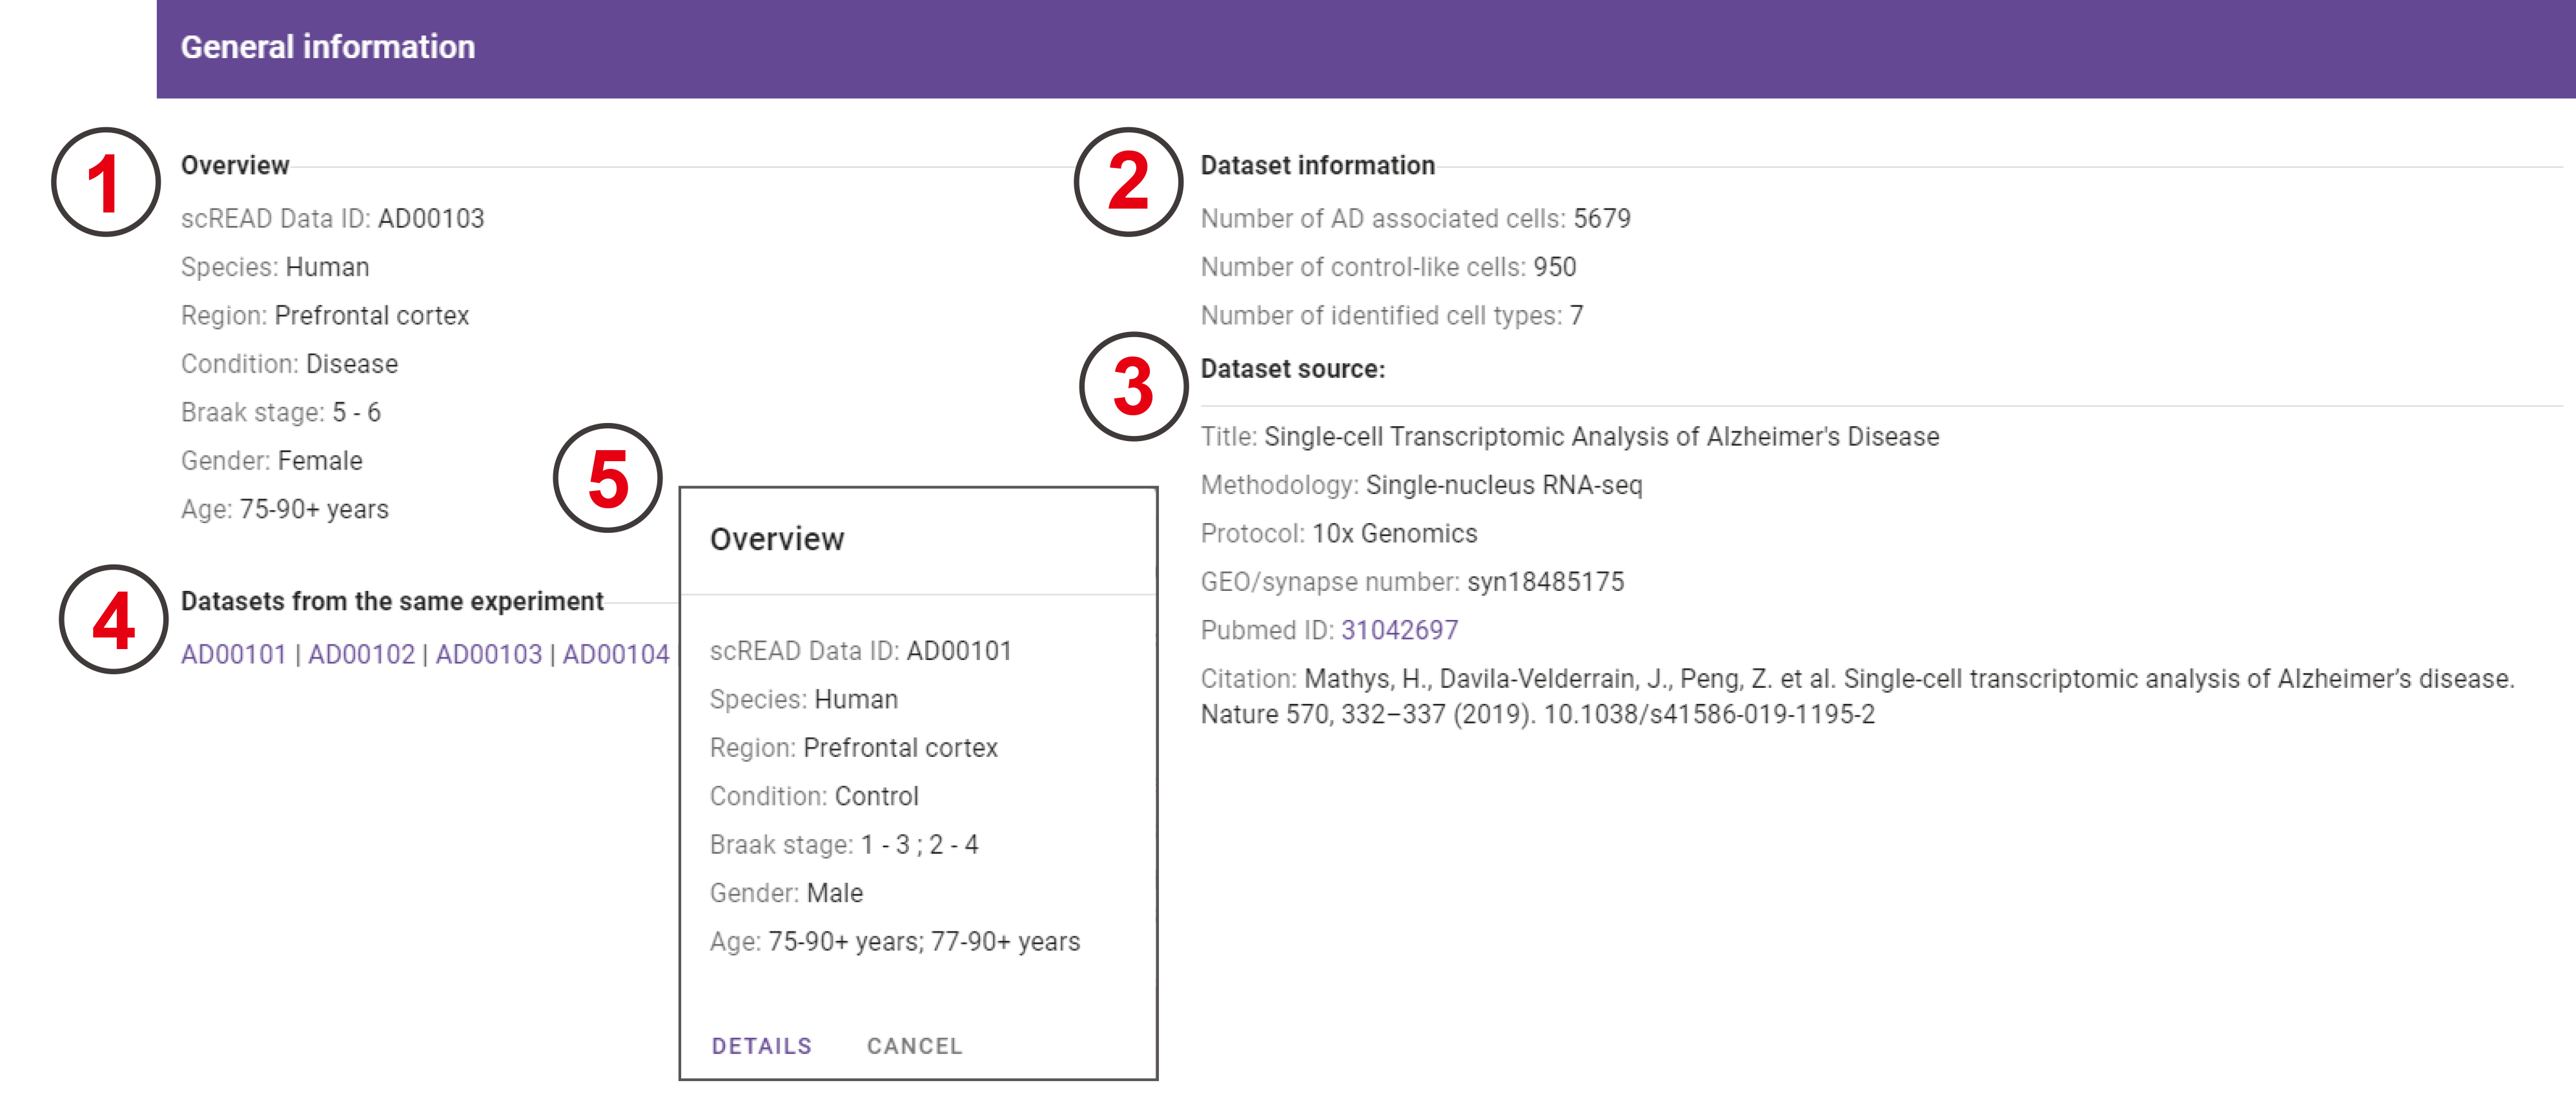
- Overview of current dataset: ‘ssREAD Data ID’, ‘Species’, ‘Region’, ‘Condition’, ‘Braak Stage’, ‘Gender’, and ‘Age’.
- The number of identified cell types, control-like cells, and AD-associated cells.
- General information of the corresponding research paper for this dataset.
- All other datasets that are included in the same experiment or publication.
- A dialog will appear when users click on the ssREAD Data ID, then users can click the ‘DETAILS’ button to go to the analysis result page of the corresponding dataset.
Cell clustering
Two high-resolution UMAP plots show the predicted cell types and the expression distribution of all genes in this dataset, respectively.
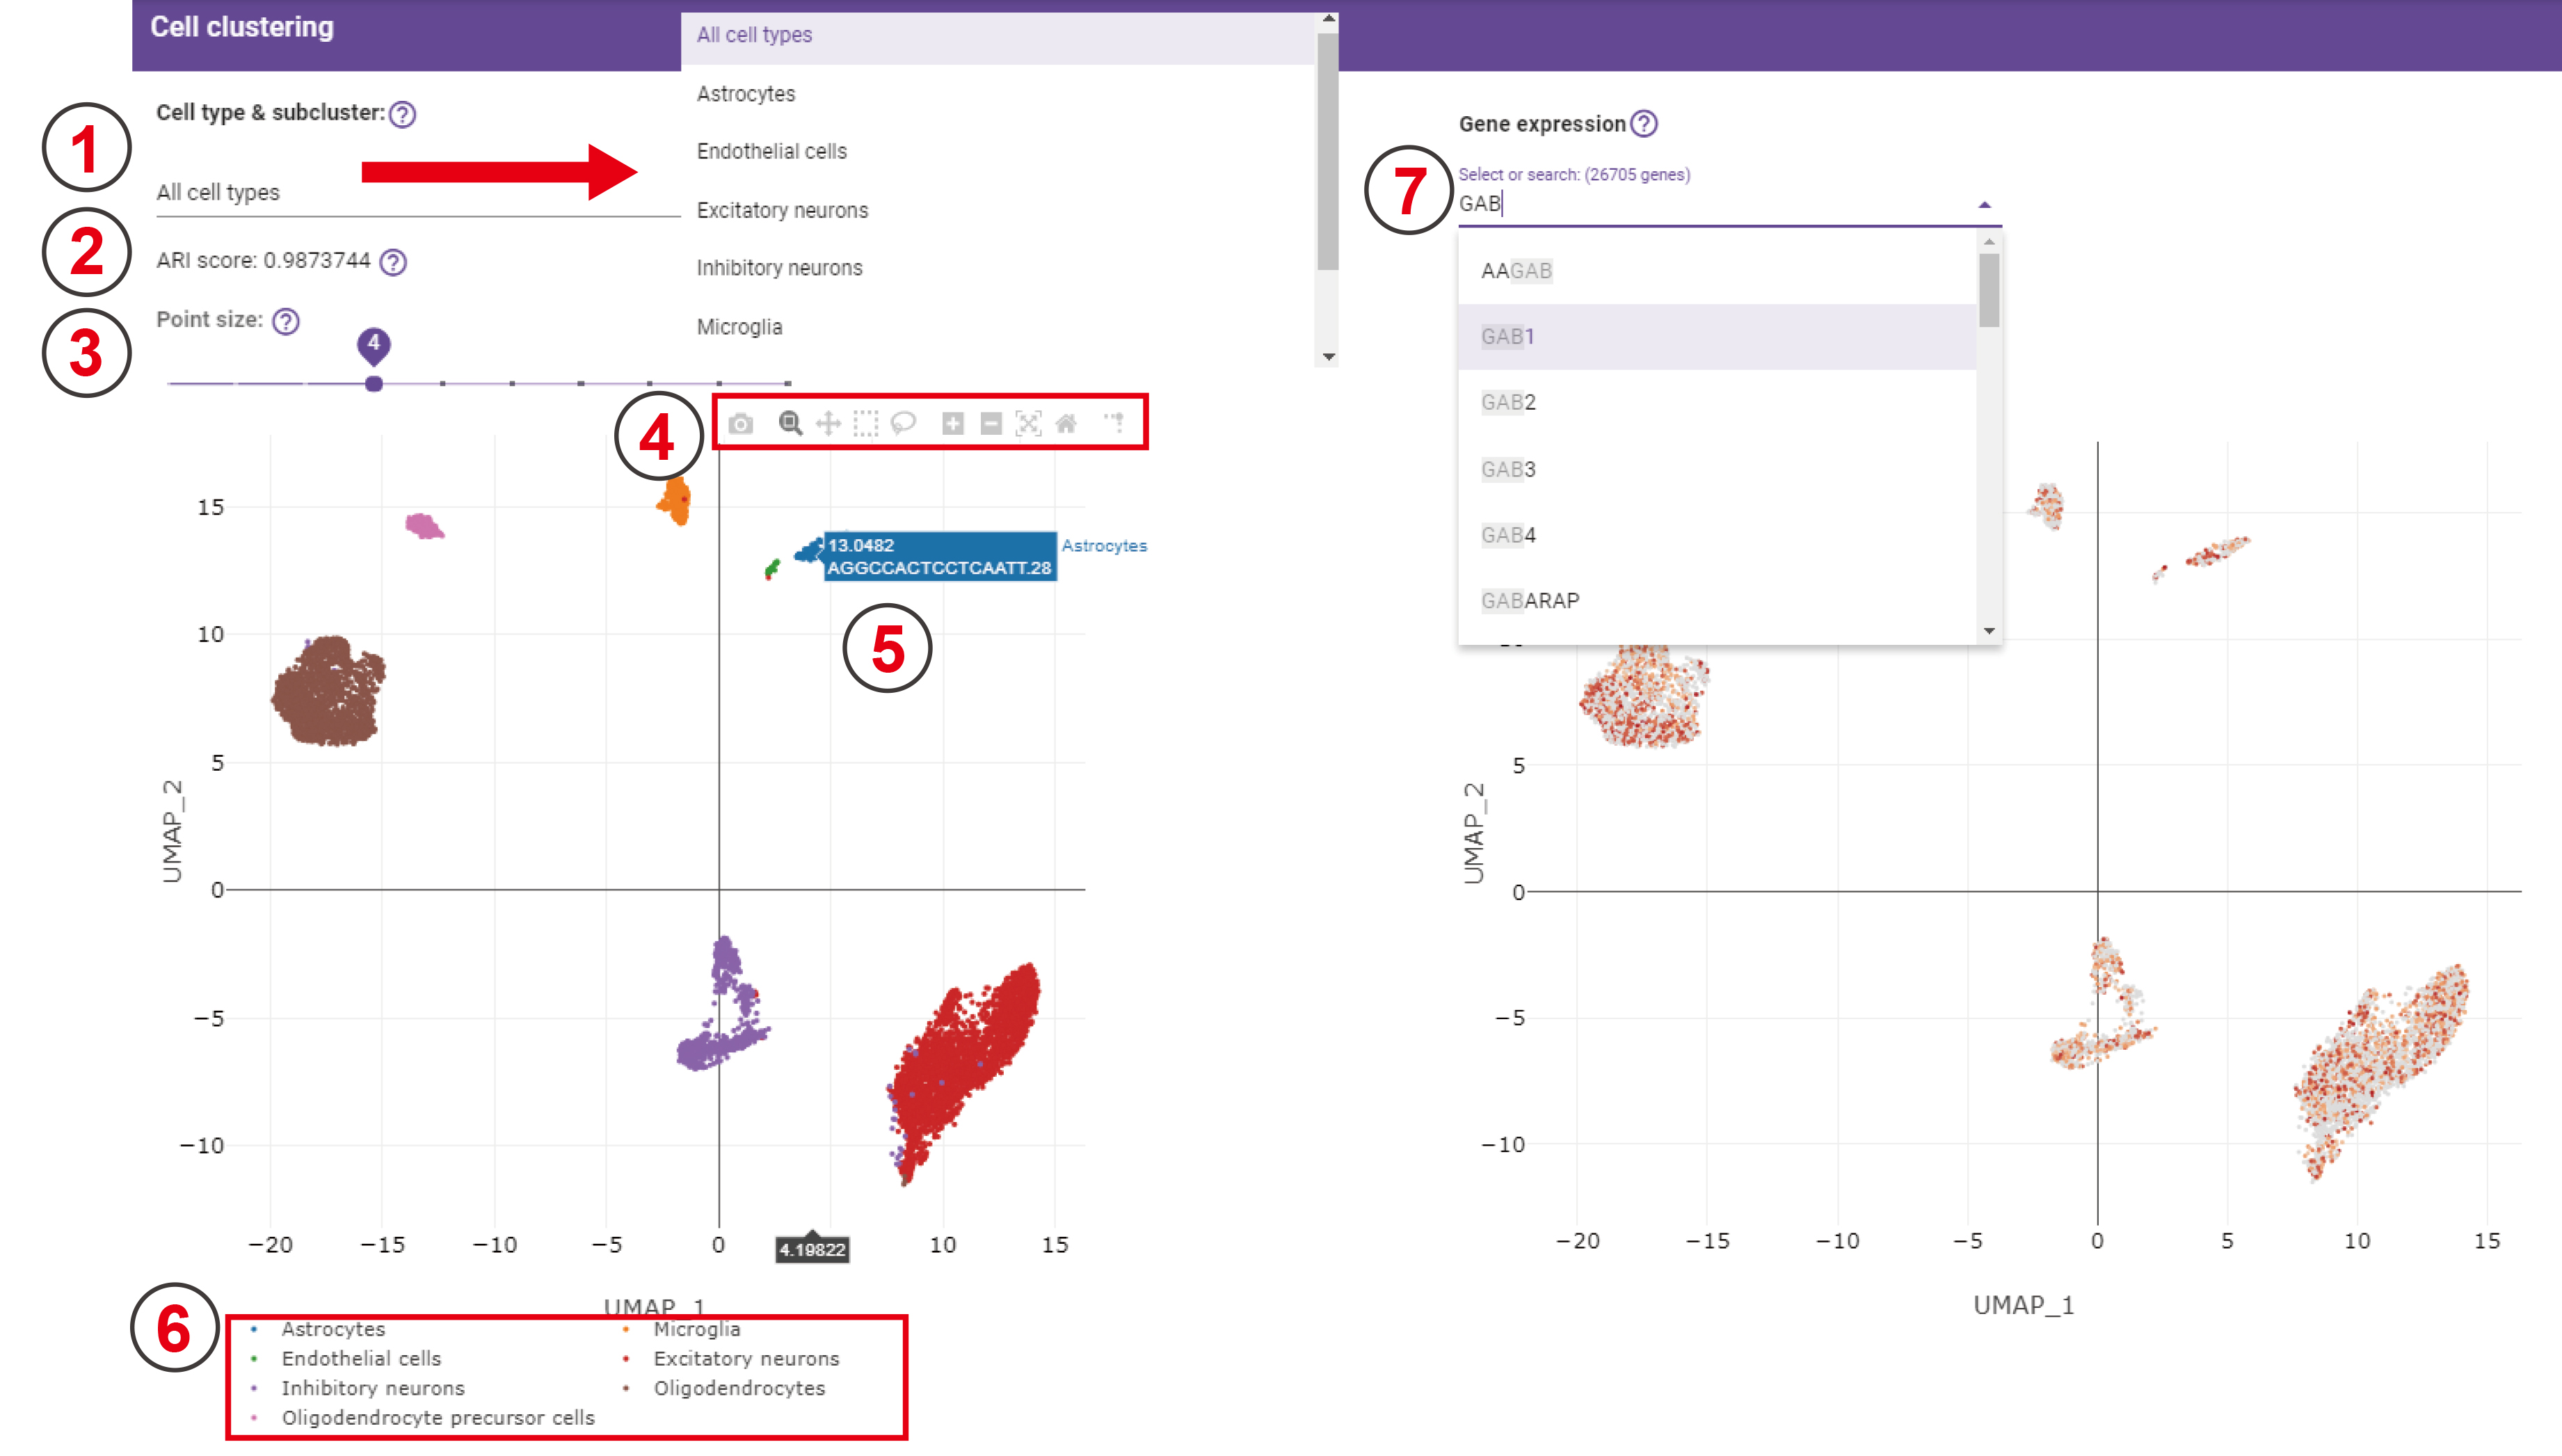
- Users choose one of these cell types, the following UMAP will change to the UMAP of predicted subclusters for this specific cell type.
- The ARI score is used to evaluate the performance of our predicted cell types compared with the original cell labels from the original paper. Note: If we don’t have the ARI score, it will show a silhouette score instead.
- A sliding bar is used for controlling the size of each point in the following UMAP. It ranges from 1 to 10, the bigger the number is, the larger the point size is.
- This function bar contains several quick buttons for graphic operations.
- Hover cursor on cell points will display cell type, cell name, and the UMAP coordinates.
- The legend of this UMAP plot.
- The genes in the drop-down bar are all genes expressed in this dataset, and users can also input the name of genes that they’re interested in. The darker the color is in this UMAP, the higher the expression value of the gene.
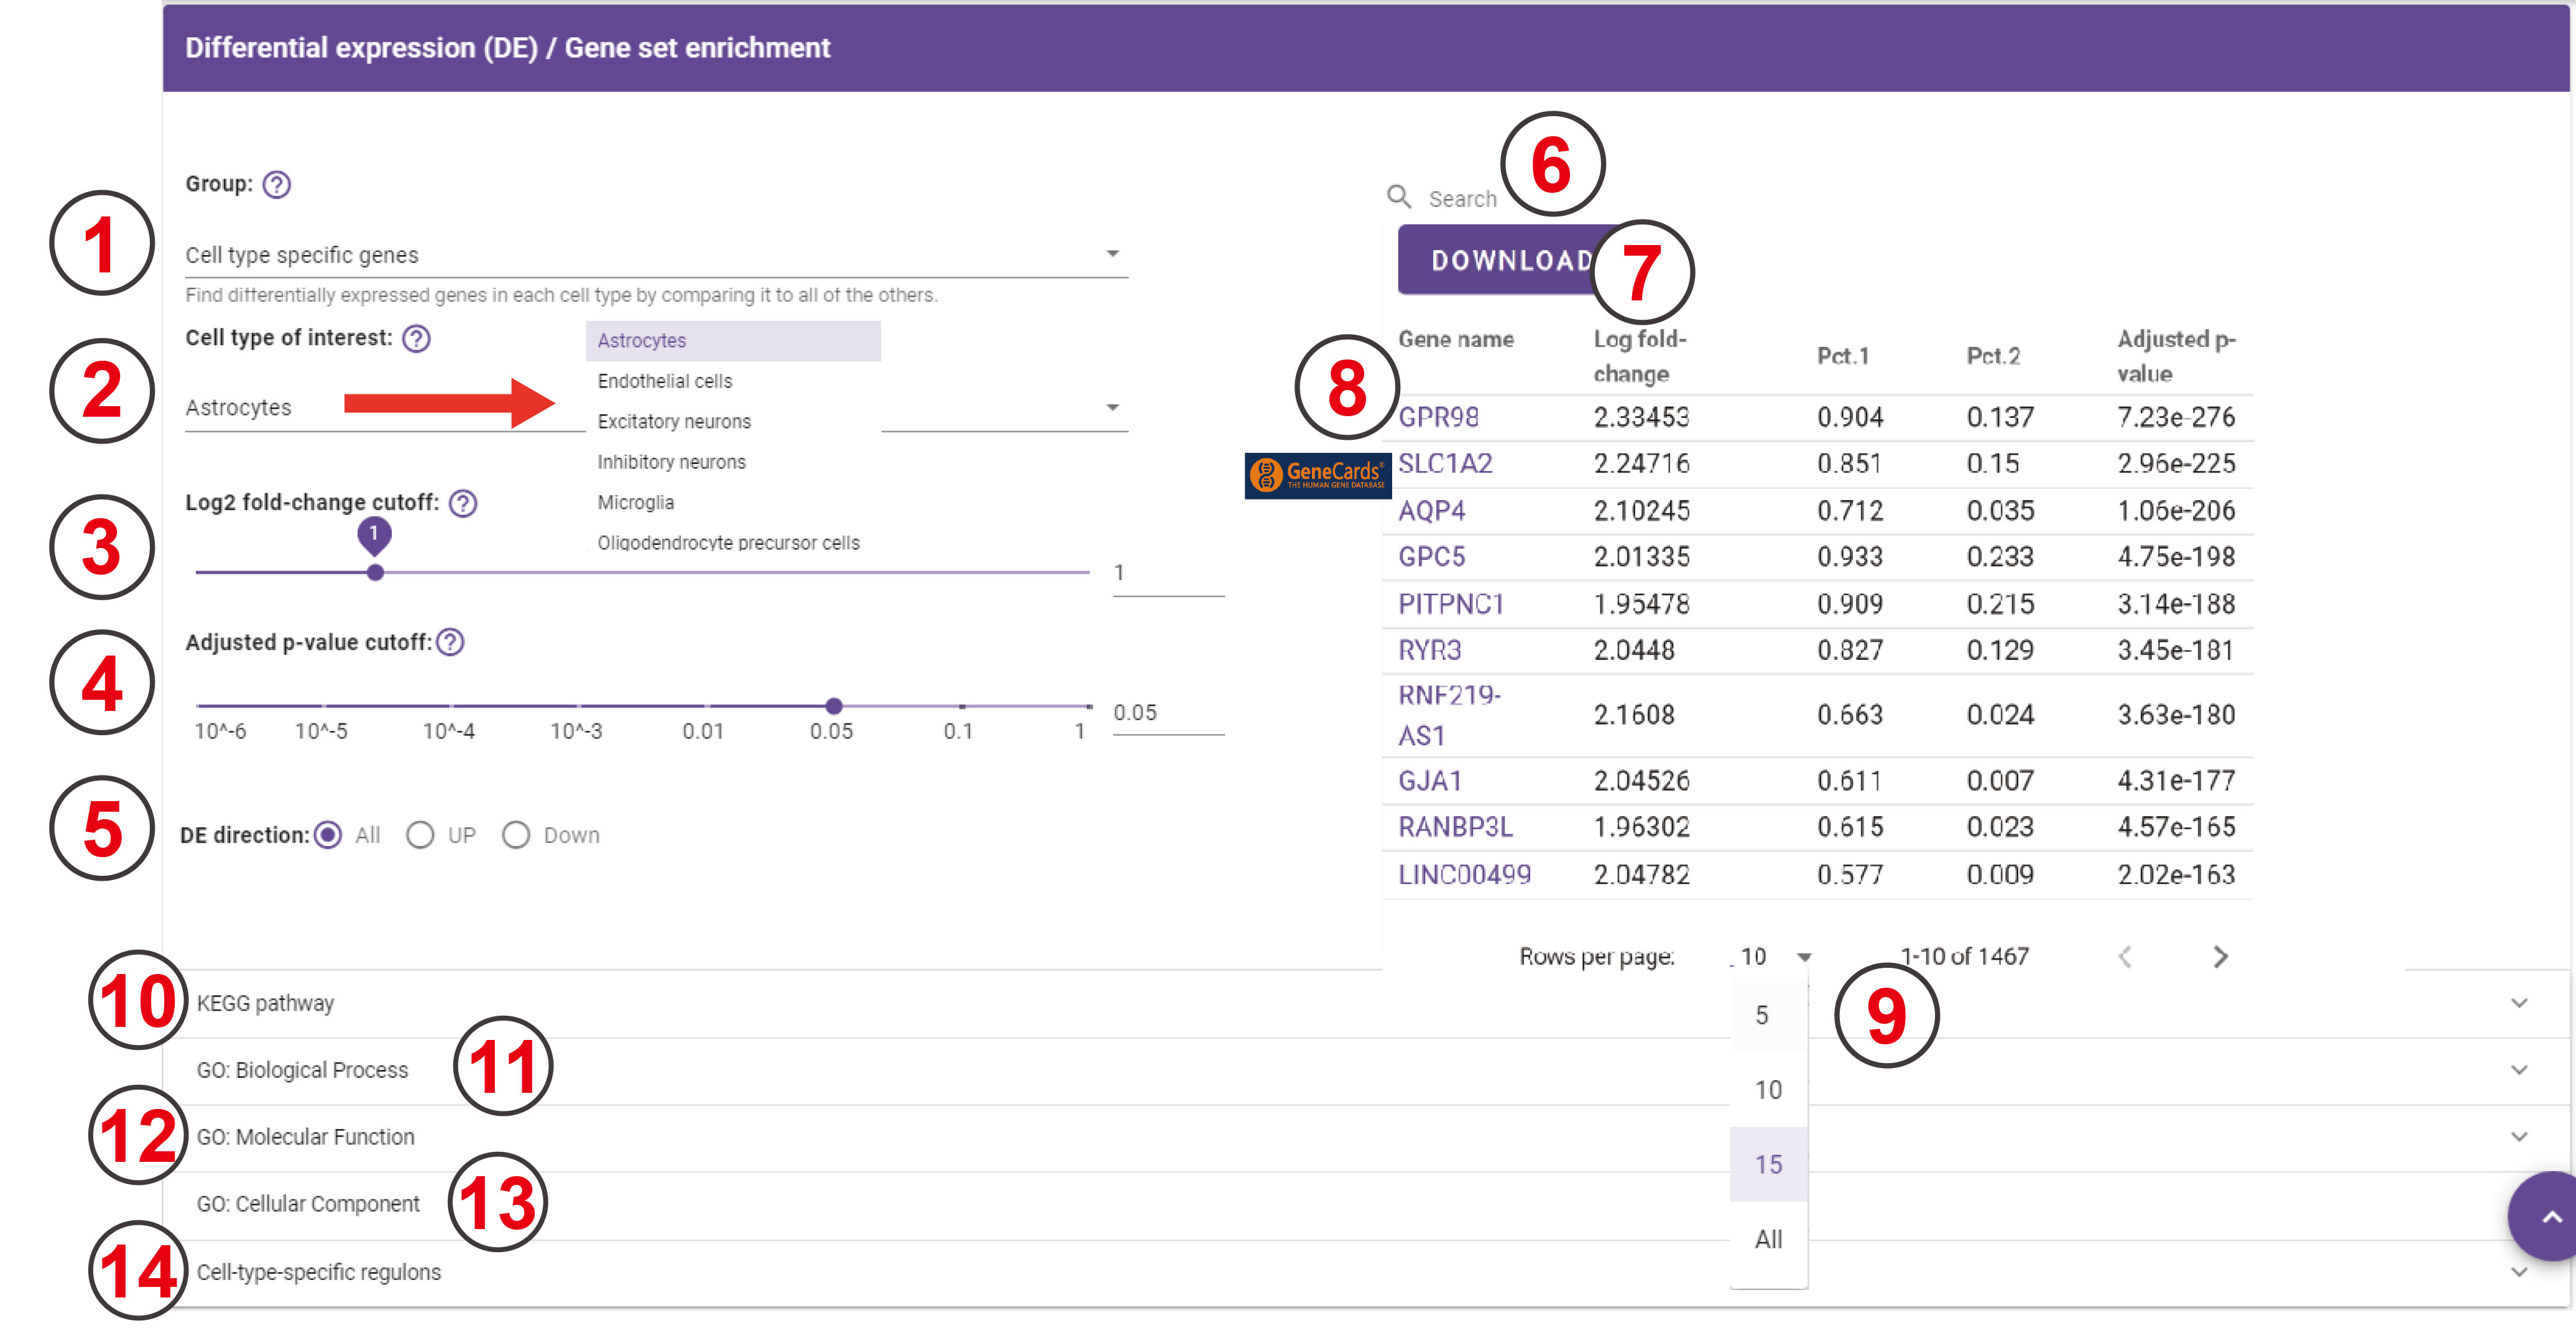
Differential expression (DE) / Gene set enrichment
-
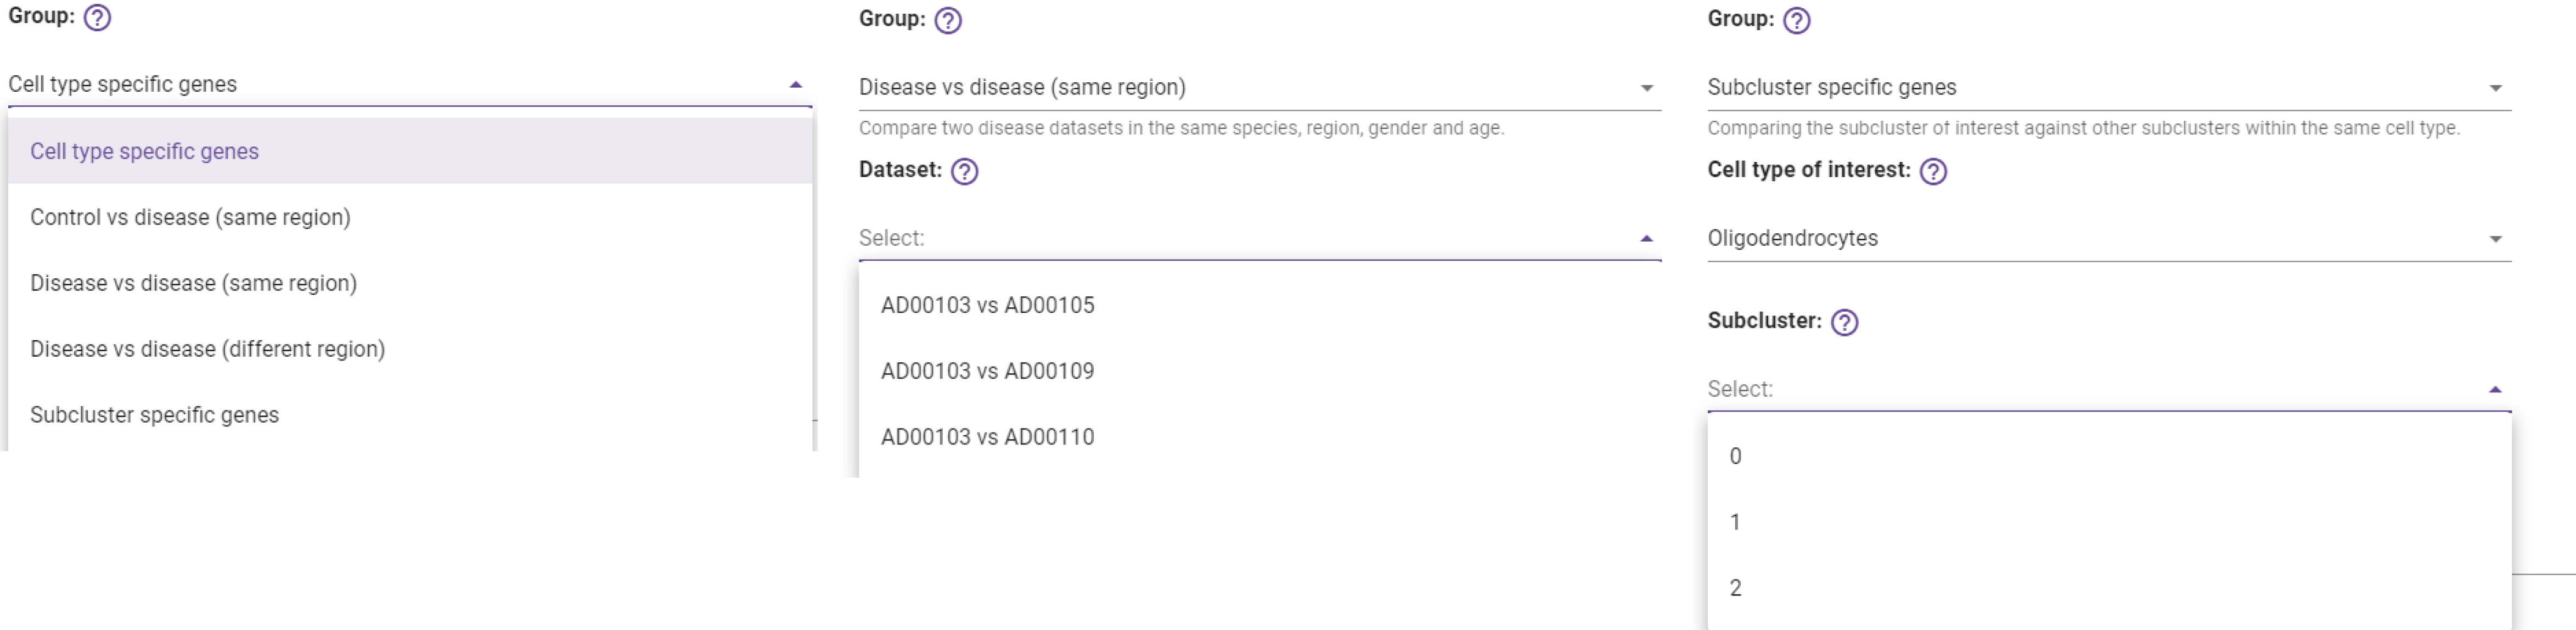
DE testing groups for browsing cell type specific genes, subcluster specific genes, and DE genes from the cross-dataset comparison.
-
Choose the cell type of interest in DE testing…
-
The Log2 fold-change ranges from 0 to 5.
-
The Adjusted p-value ranges from 10^-6 to 1.
-
The DE direction can be filtered by all DE genes, only up-regulated genes, or only down-regulated genes.
-
Users can search for genes that they are interested in, and then the following table will return the matching result.
-
Download the currently listed table.
-
Genecards database is linked to each gene in the table.
-
Set how many rows should the table show.
-
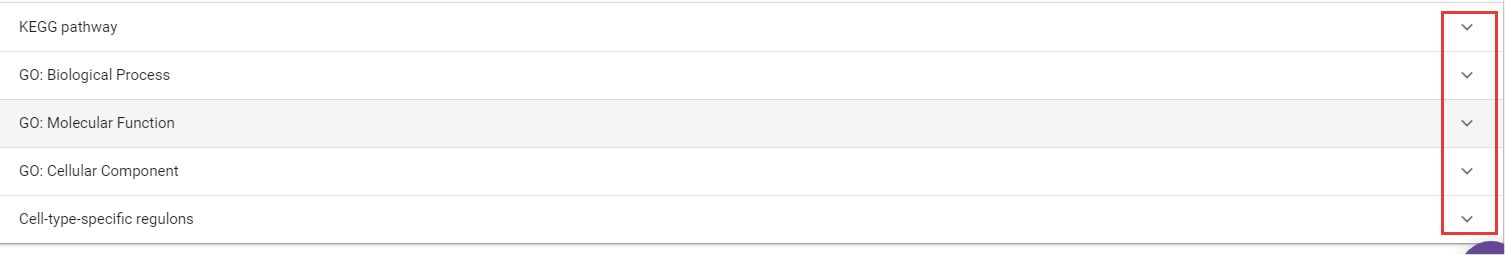
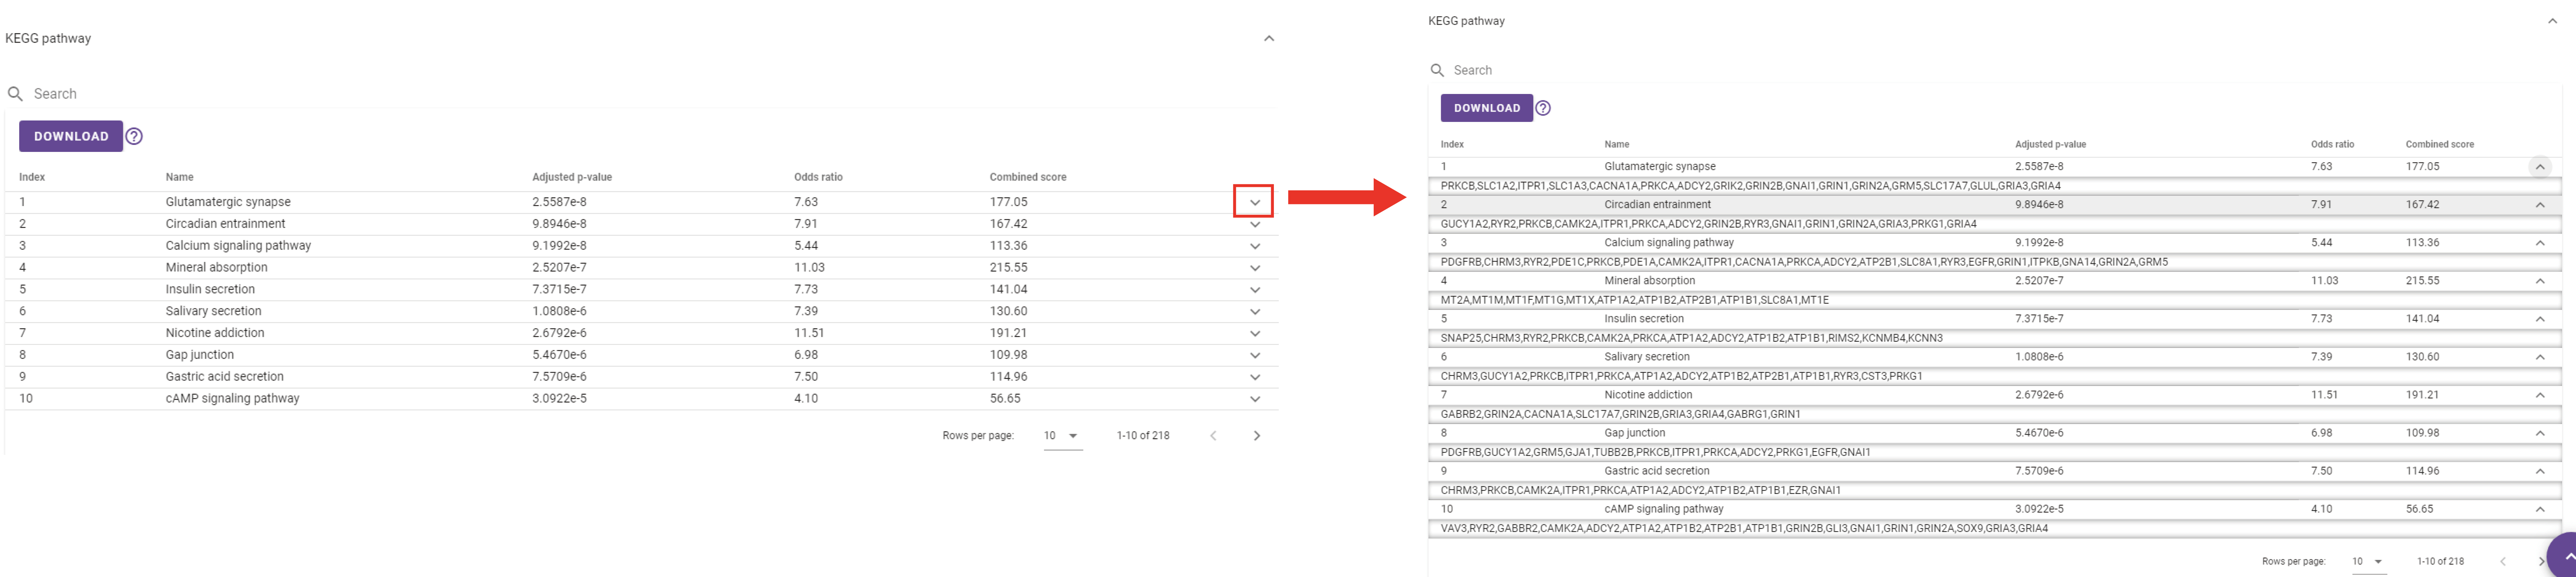
KEGG pathway enrichment analysis result table of the DEGs will appear when users click the inverted triangle, and this table can be downloaded when they click the ‘Download’ button. When users click the reversed triangle at the end of each row in this table, it shows the genes that are enriched on this pathway, and this table can be downloaded when they click the ‘Download’ button. Users can also search for a specific item by entering the content they want to search in the search box.
-
GO biological process analysis result of the DEGs. Please see entry 10 to know how to use it.
-
GO molecular function analysis result of the DEGs. Please see entry 10 to know how to use it.
-
GO cellular component analysis result of the DEGs. Please see entry 10 to know how to use it.
-
Cell-type-specific regulon analysis result table of this dataset will appear when users click the inverted triangle, and this result only shows up when they choose the ‘Cell type specific genes’ in the ‘Group’ drop-down bar.
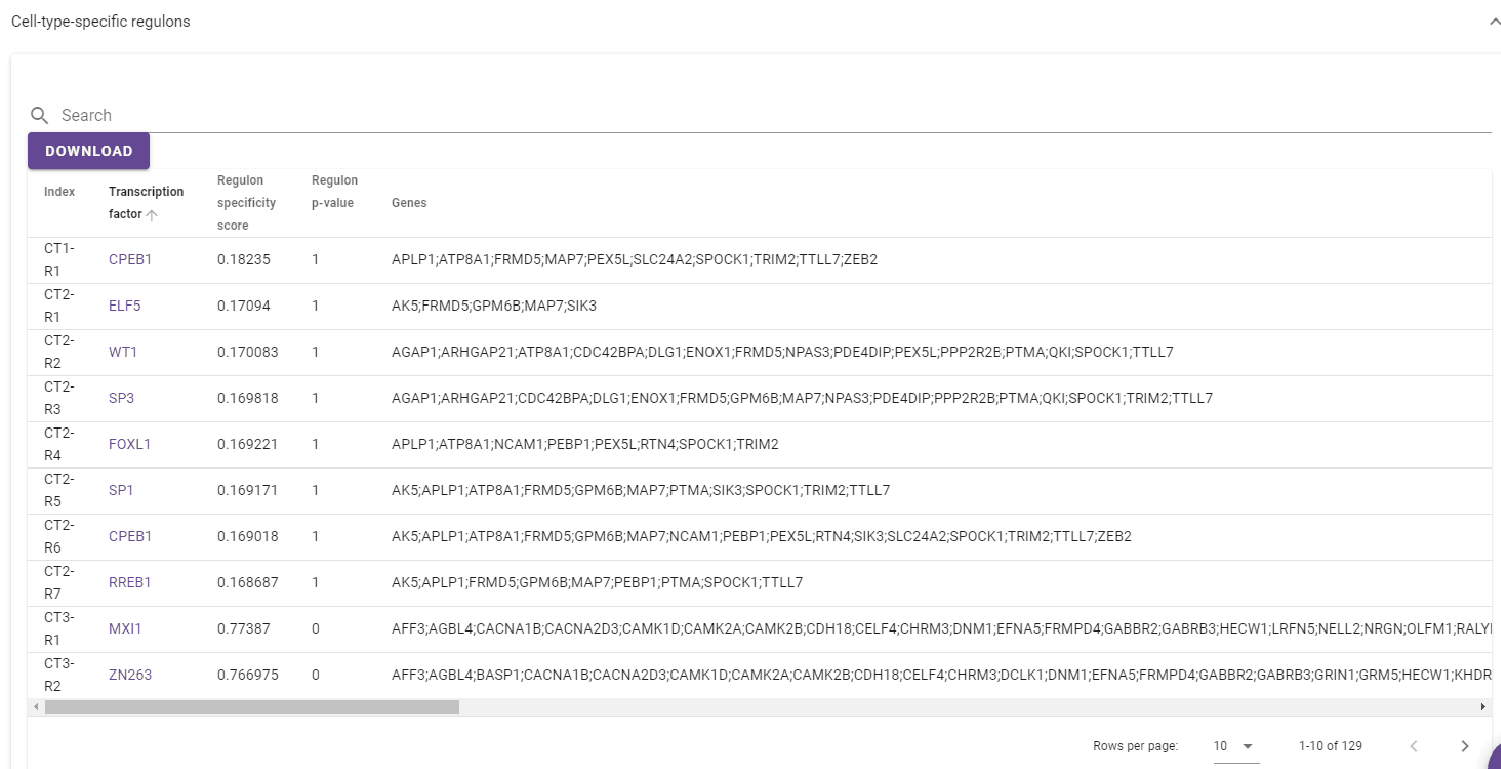
This is the cell-type-specific regulon result table for each cell type, and this table can be downloaded when you click the ‘Download’ button.
Spatial Transcriptomics Result Illustration
We used the dataset ST00109 to showcase the functions of the database. It comes from the dorsolateral prefrontal cortex region of a 30-year-old, caucasian female in a non-diseased state in Maynard, et al. research.
This tutorial will guide you through the analysis result page of ssREAD in detail.
General Information
The summary of this dataset is shown in the first section of the analysis result page. This section includes two parts: (1) Publication and (2) Study design.

-
Publication Overview: ‘Title’, ‘Date published’, ‘Date added’, ‘Abstract’, ‘Protocol’, and ‘Data’.
-
Study Design: ‘Species’, ‘Number of Samples’, ‘Region’, ‘Experimental factors’, ‘Description’, and ‘Figure: Spatial transcriptomics in DLPFC using Visium’.
Spot-level data
The ‘Spot-level data’ section allows users to select specific samples from the dataset and manipulate interactive UMAP plots that show predicted cell types, the expression and distribution of genes, and the number of spots of each cell type.

-
Users select their desired sample from the dataset. For this example, ST00109 was used. The following UMAP will change to the UMAP of predicted subclusters for this specific sample.
-
Choose to plot by layer or cluster.
-
View the processed or raw image.
-
A sliding bar is used to control the size of each point in the UMAP. It ranges from 1 (smallest) to 10 (largest).
-
This function bar contains several quick buttons for graphic operations.
-
A sliding bar is used to control the opacity of the underlying raw image and the plotted points. It ranges from 1 (translucent) to 10 (completely opaque) for both functions.
-
Hover the cursor on cell points to display cell type, cell name, and UMAP coordinates.
-
Hover the cursor on cell points to display cell type, cell name, and UMAP coordinates.
-
The legend of this UMAP plot.
-
Hover the cursor on a bar to display the number of spots and cell type.
-
Select or search a gene of interest to plot the gene expression value on the UMAP plot. A darker point will indicate a higher expression value.
Spatially variable genes

-
Users select their desired sample from the dataset. For this example, ST00109 was used.
-
A sliding bar is used to change the Log2 fold-change cutoff. This ranges from 0 to 5.
-
A sliding bar is used to vary the adjusted p-value from 10^-6 to 1.
-
The foldchange direction can be filtered by all spatially variable genes, only up-regulated genes, or only down-regulated genes.
-
Users can search for genes that they are interested in, and then the following table will return the matching result.
-
Download or copy the currently listed table.
-
Genecards database is linked to each gene in the table.
-
Set how many rows the table shows.
Differential expression (DE)/ Gene set enrichment

-
Users select their desired sample from the dataset. For this example, ST00109 was used.
-
Users select to either cluster specific genes or layer specific genes between two sets of cells.
-
Users select the cell type to perform differential analysis.

-
The Log2 fold-change ranges from 0 to 5.
-
The Adjusted p-value ranges from 10^-6 to 1.
-
Users can search for genes that they are interested in, and the table will return matching results.
-
Users can download or copy the table.
-
Genecards database is linked to each gene in the table.
-
Users can set how many rows are shown in the table.
-
The DE direction can be filtered by all DE genes, only up-regulated genes, or only down-regulated genes.
-
KEGG pathway enrichment analysis result table B of the DEGs will appear when the user clicks the drop-down arrow (a). This table can be downloaded or copied when the user clicks on the ‘Download’ or ‘Copy DEG’ button (b). If the user clicks on the drop-down arrow © in table B, they can see the genes that are enriched on this pathway. This table can also be copied or downloaded by clicking ‘Download’ or ‘Copy DEG’. Users can click on the links to UNIPROT or GENECARDS to view the results for each gene in these databases (d).

-
GO Biological Process analysis result of the DEGs. Entry 11 above can be used to navigate this feature.
-
GO Molecular Function analysis result of the DEGs. Entry 11 above can be used to navigate this feature.
-
GO Cellular Component analysis result of the DEGs. Entry 11 above can be used to navigate this feature.
Deconvolution

-
Users select desired spatial transcriptomics sample from the dataset. For this example, ST00109 was used.
-
Users select desired scRNA-seq dataset to compare to the spatial sample and perform cell-type deconvolution.
-
Average gene expression (scaled 0-1) for each spot from a mixture of cells of potentially heterogeneous cell types. The outputs are the estimated cell-type composition across spatial locations for the corresponding scRNA-seq dataset.
-
Correlations in proportions of cell-types across spatial locations between cell-type pairs, where correlations range from -1 (dark sage green) to 1 (burgundy).
Query
The ‘Query’ page allows users to search for specific DEGs by using different filters. Users can also find overlapping DEGs from multiple comparisons.

-
Users can search for a differentially expressed gene of their choice. For this example, GPR98 was used.
-
Users can click the drop-down arrow to filter by species: human or mouse.

-
Users can click the drop-down arrow to filter by experimental condition: control or disease.

-
Users can click the drop-down arrow to filter by comparison type: cell type specific, subcluster specific, or cross dataset comparison.

-
Users can click the drop-down arrow to filter by subject sex.

-
Users can click the drop-down arrow to filter by cell type.

-
Users can click the drop-down arrow to filter by brain region.

-
Users can click the ‘Download Current Table’ button to download the produced table.
-
Users can click the ‘Reset Filter’ button to erase their selected filters and return to default.
-
Users can select from the drop-down menu what species (mouse or human) they want to search for when finding overlapping DEGs from multiple comparisons.
-
Users can select from the drop-down menu what brain region they want to search for when finding overlapping DEGs from multiple comparisons.
-
Users can input the number of comparisons threshold for their overlapping DEGs search.
-
Users can input the number of top DEGs they want to see in their overlapping DEGs search.
-
The DE direction can be filtered by all DE genes, only up-regulated genes, or only down-regulated genes.
-
Click the ‘Search’ button to produce results of overlapping DEGs from multiple comparisons.